Working artefacts from the team’s own fall and spring reports, which I co-authored. One interviewed company is named with its permission in the report.
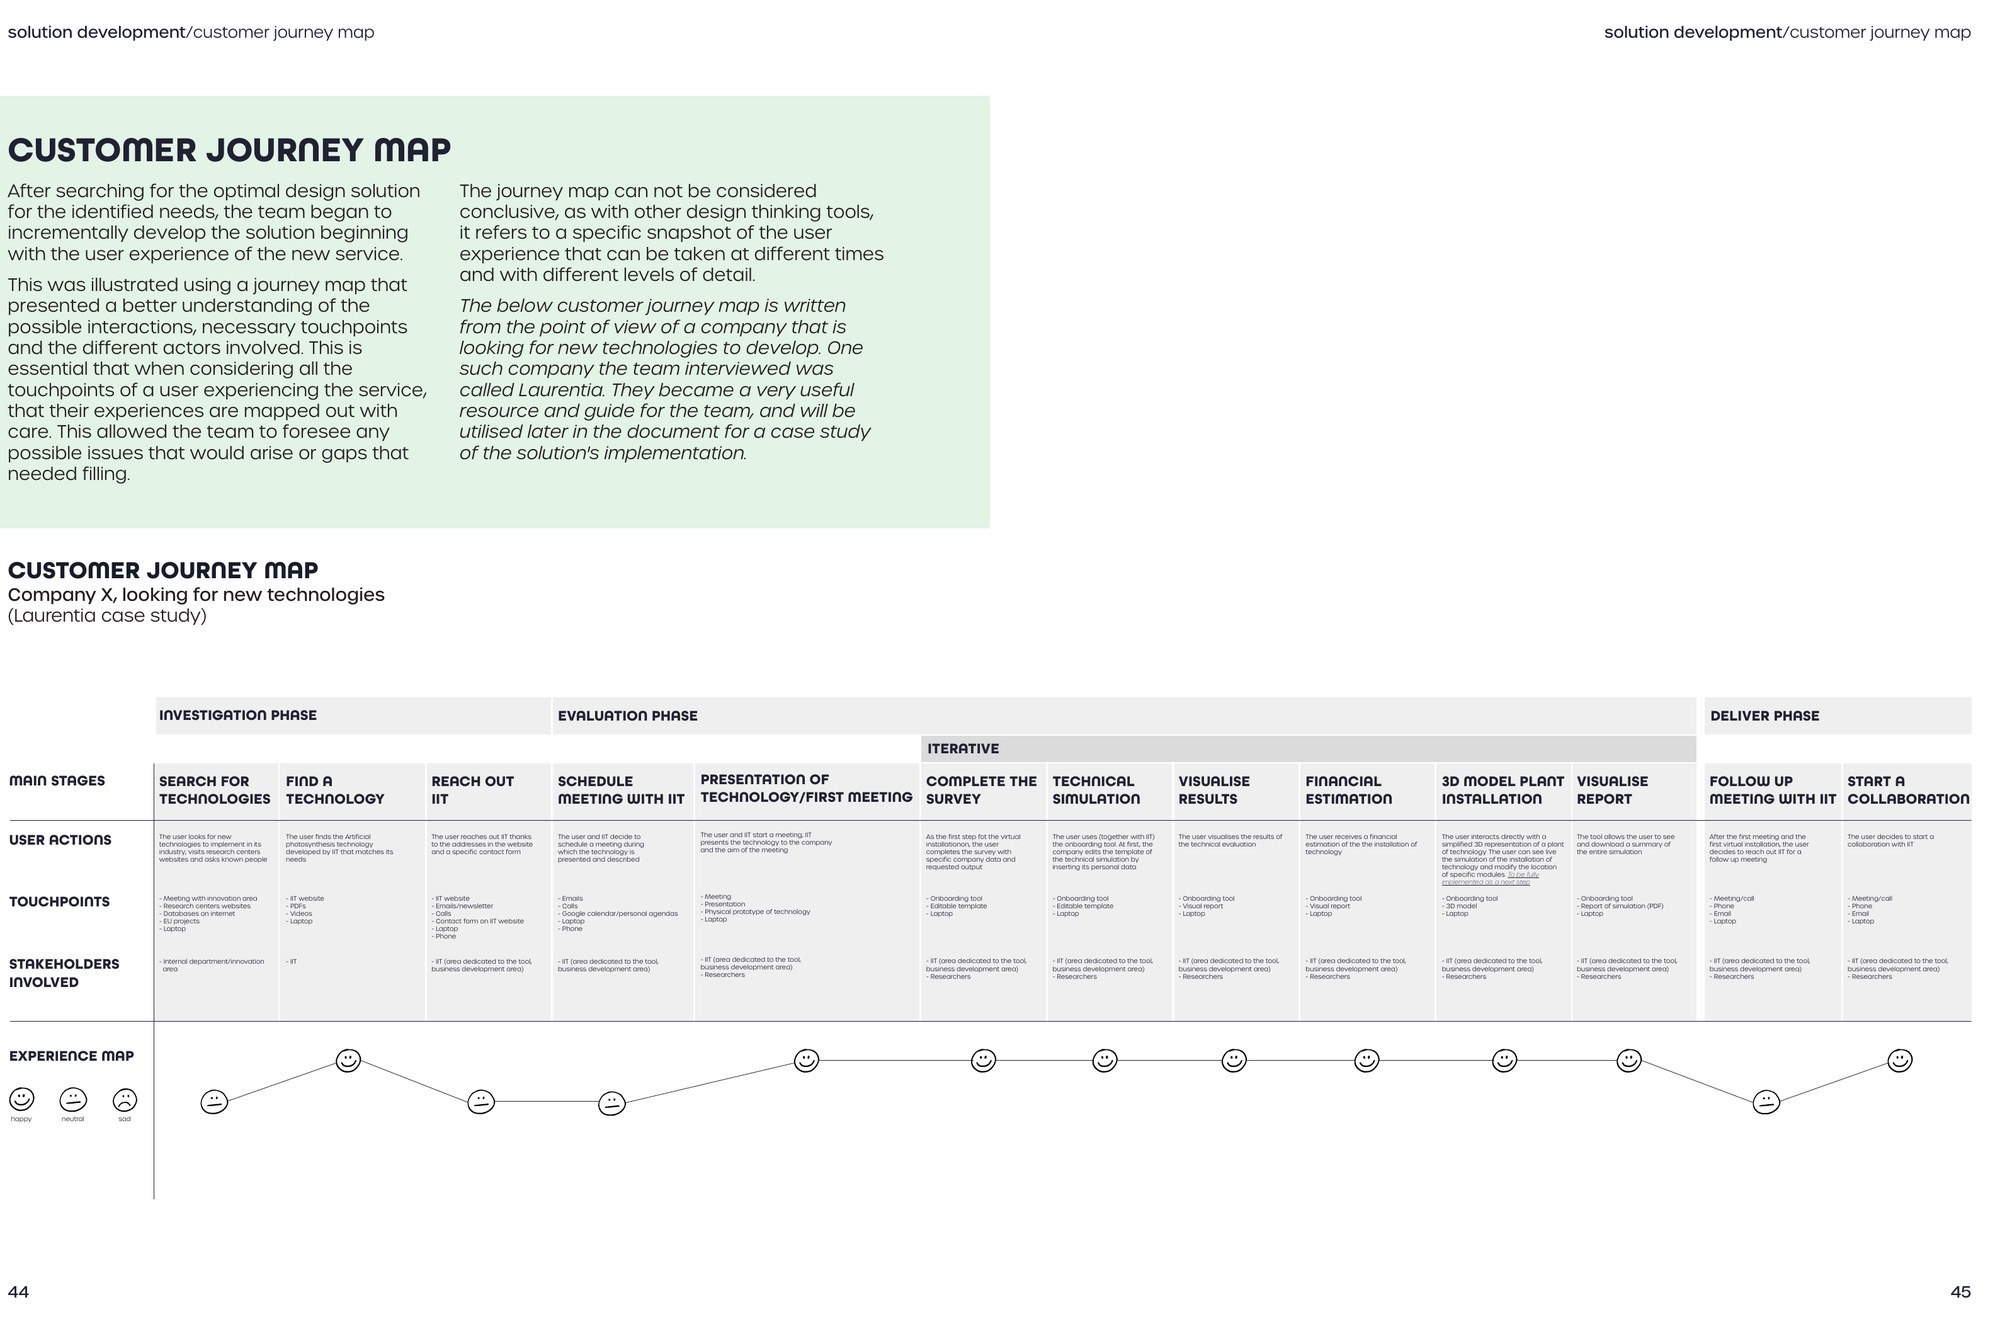
SKETCH 1 OF 4Customer journey mapA customer journey map across investigation, evaluation and deliver phases. Rows list main stages, user actions, touchpoints and stakeholders involved. An experience map at the bottom plots happy, neutral and sad faces along the journey.FED INTO ·Journey and experience mapping ▸
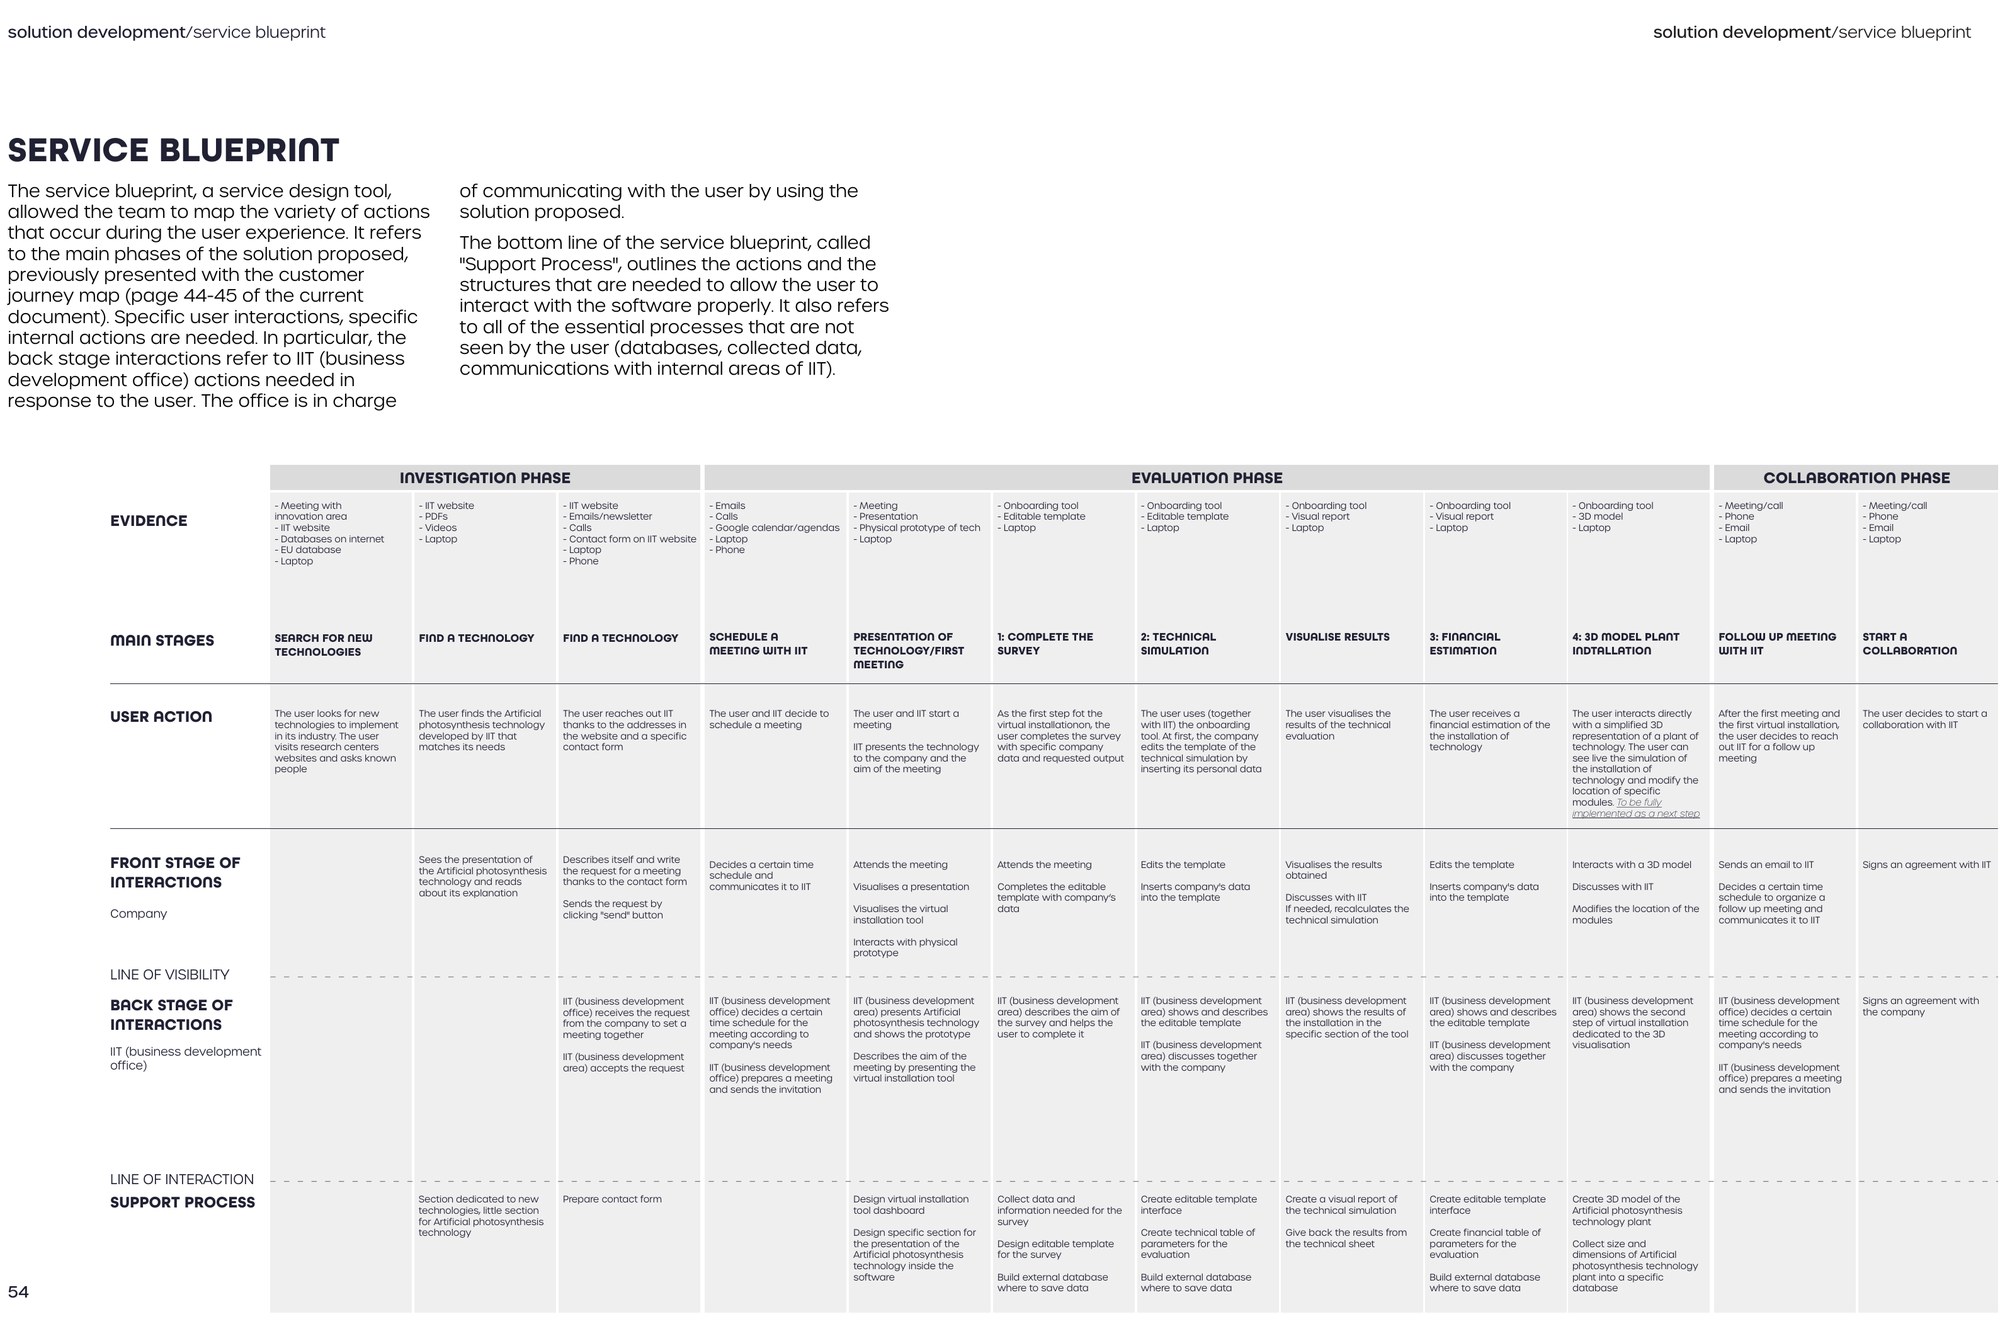
SKETCH 2 OF 4Service blueprintA service blueprint split into evaluation and collaboration phases. Columns cover completing the survey, the technical simulation, visualising results, financial estimation, 3D model plant installation, the follow-up meeting and starting a collaboration. Rows below a dashed line of visibility describe what the institute does at each step.FED INTO ·Service blueprints ▸Project 04 · CO/LAB ▸
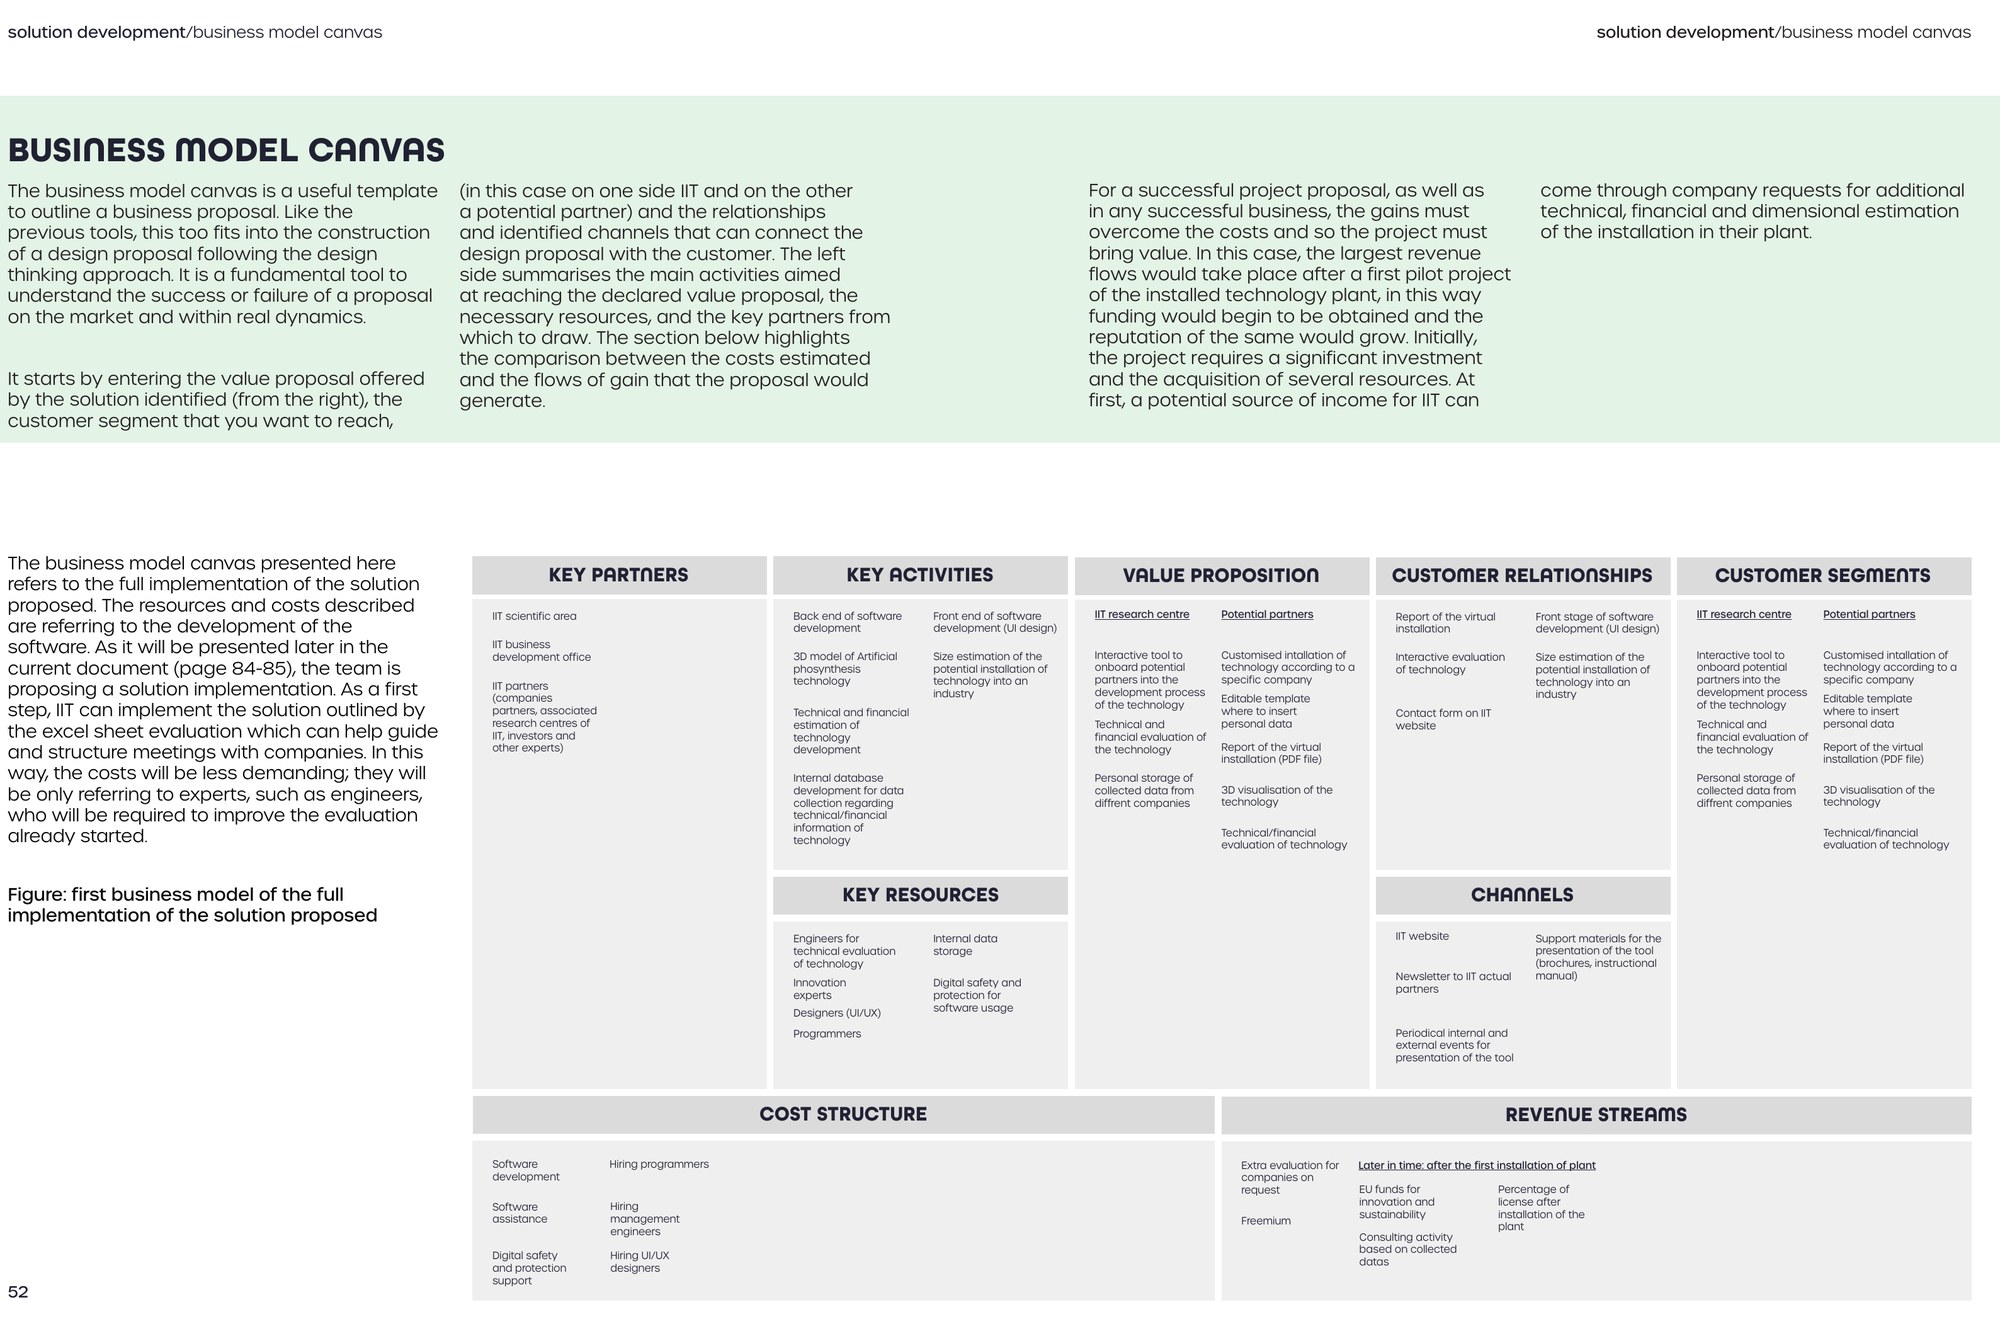
SKETCH 3 OF 4Business model canvasA business model canvas with panels for key partners, key activities, value propositions, customer relationships and customer segments across the top, and cost structure and revenue streams along the bottom.FED INTO ·Project 04 · what we delivered ▸
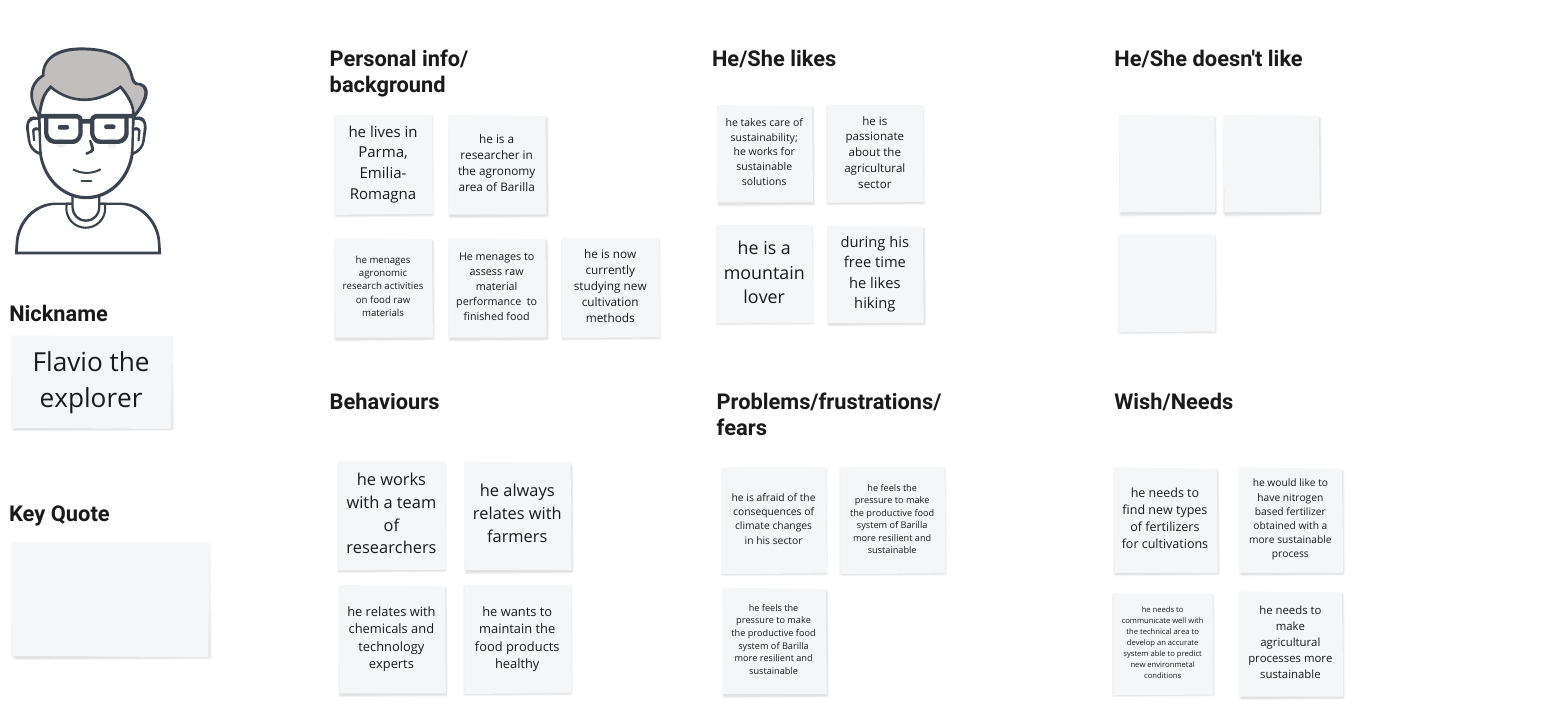
SKETCH 4 OF 4Persona canvas, first draftA draft persona canvas for Flavio the explorer, a Barilla agronomy researcher in Parma. Sticky notes fill sections for personal info, likes, behaviours, problems and fears, and wishes and needs. The key quote box is still empty. Drafts like this one, built from each interview, became the five industry personas in the fall report.FED INTO ·Personas ▸