My own sketches, notebook and working specs, made by hand while I designed this. Student names are invented.
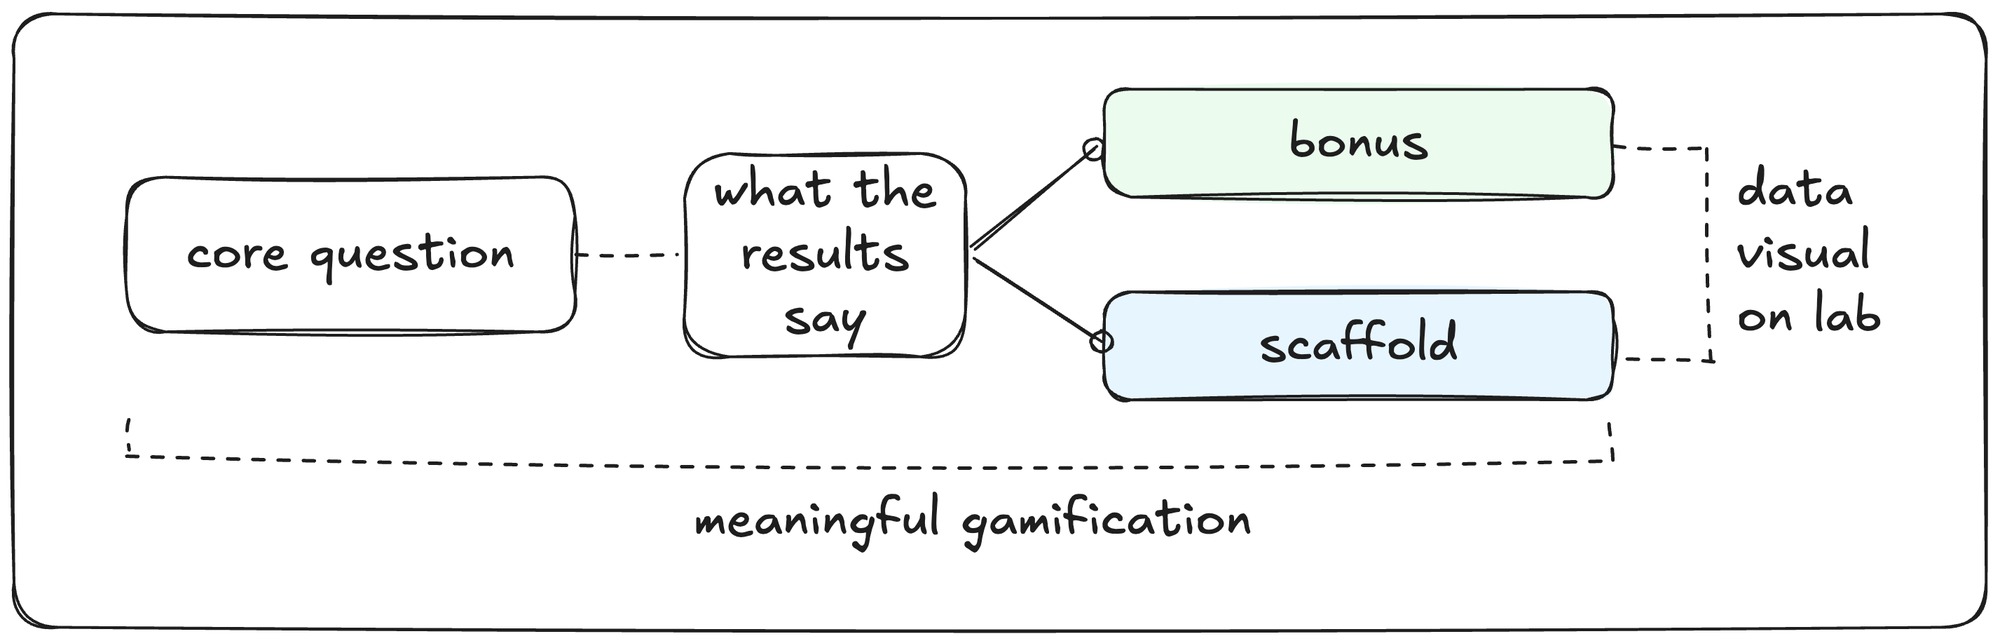
SKETCH 1 OF 4The fork, first sketchA hand-drawn diagram. A rounded box reading core question connects by a dashed line to what the results say, which forks into two boxes, bonus in green and scaffold in blue. Both feed a note reading data visual on lab. A dashed line runs under the whole thing labelled meaningful gamification.FED INTO ·Project 03 · the fork ▸
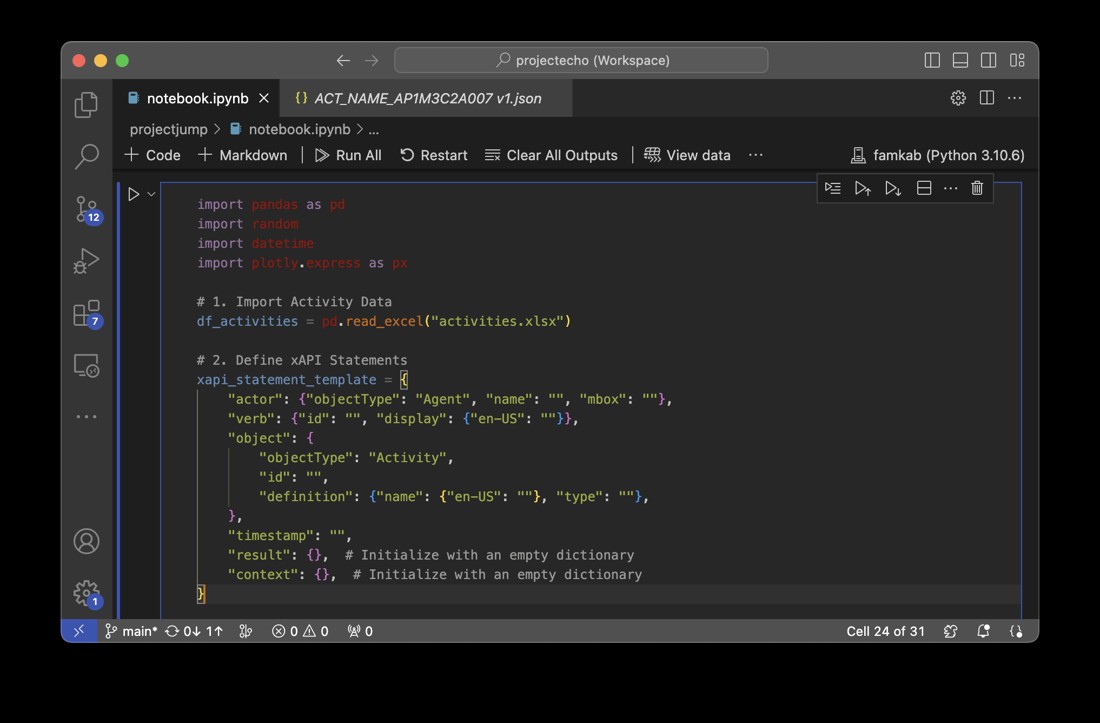
SKETCH 2 OF 4What an activity recordsA code notebook open beside an activity file. It imports the activity data from a spreadsheet, then defines an xAPI statement template with fields for the actor, the verb, the object and its definition, a timestamp, a result and a context.FED INTO ·Learning analytics ▸
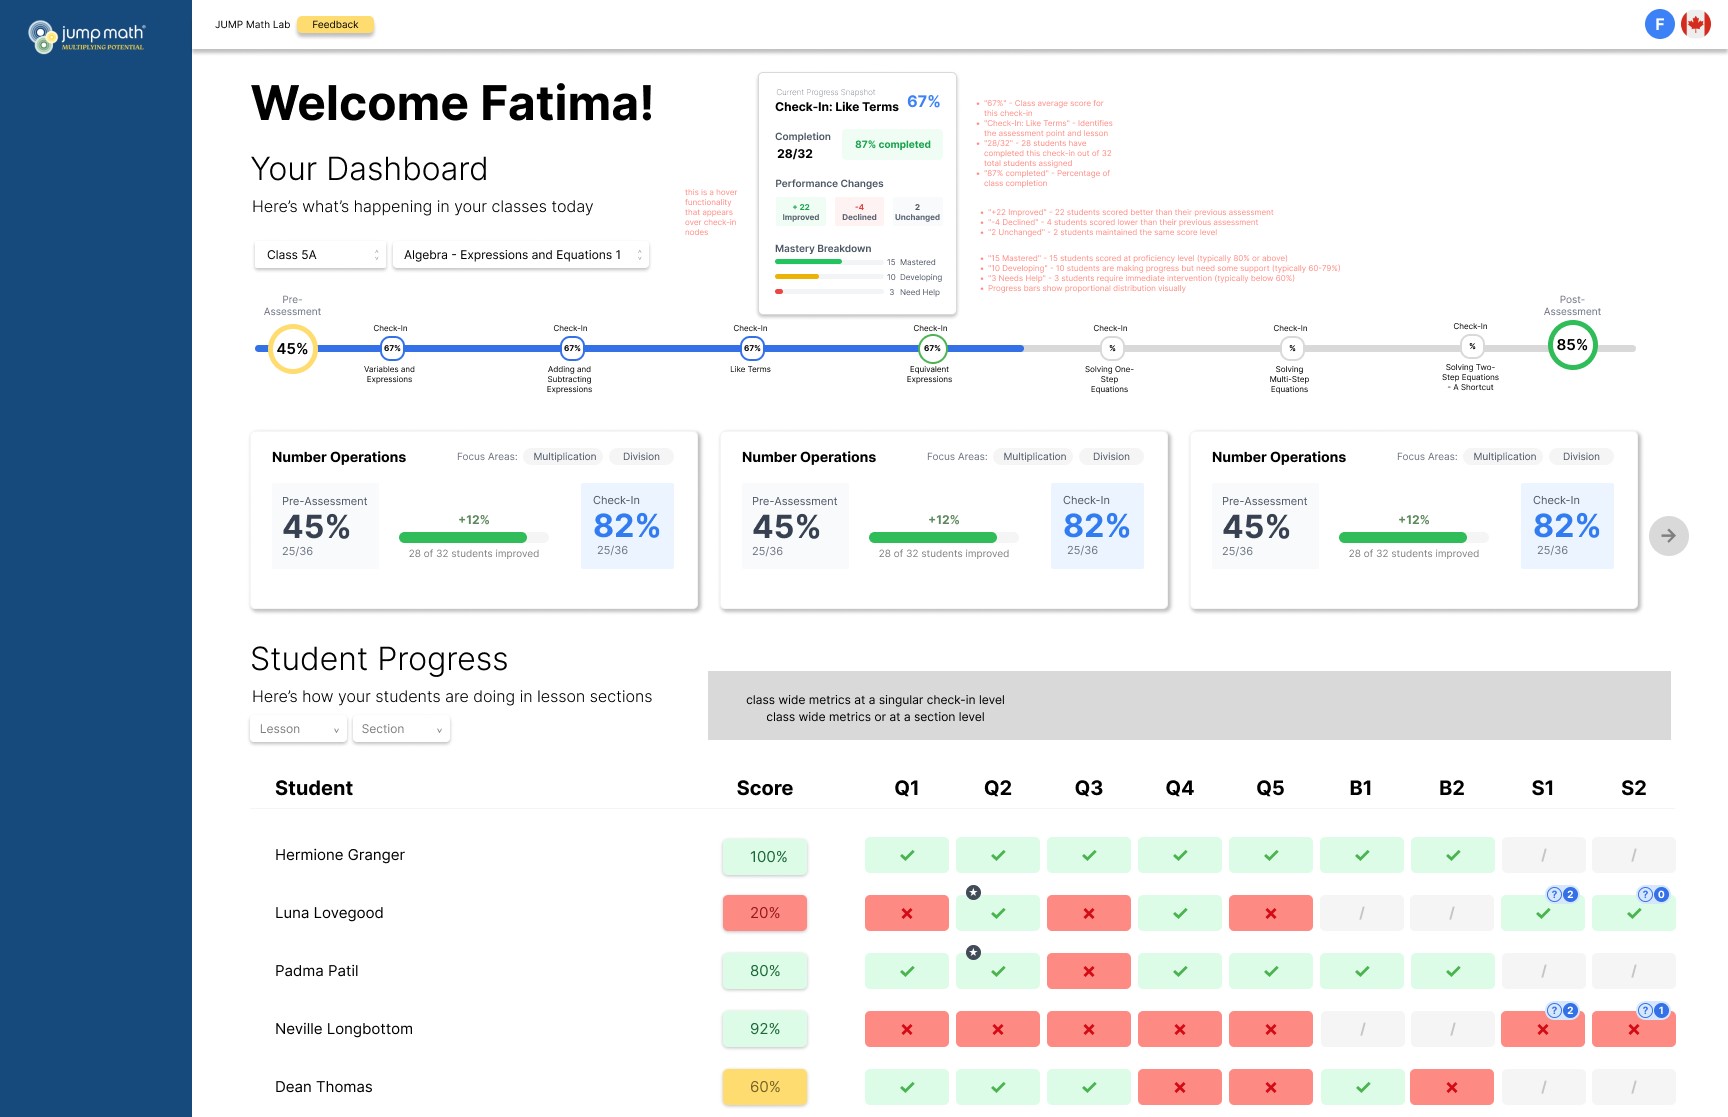
SKETCH 3 OF 4The check-in timelineAn annotated design spec for the JUMP Math teacher dashboard. A row of assessment nodes runs across the top with a hover panel showing a mastery breakdown, over a grid of students against questions. Handwritten notes in red down both margins point at elements and explain them.FED INTO ·Project 03 · the teacher dashboard ▸
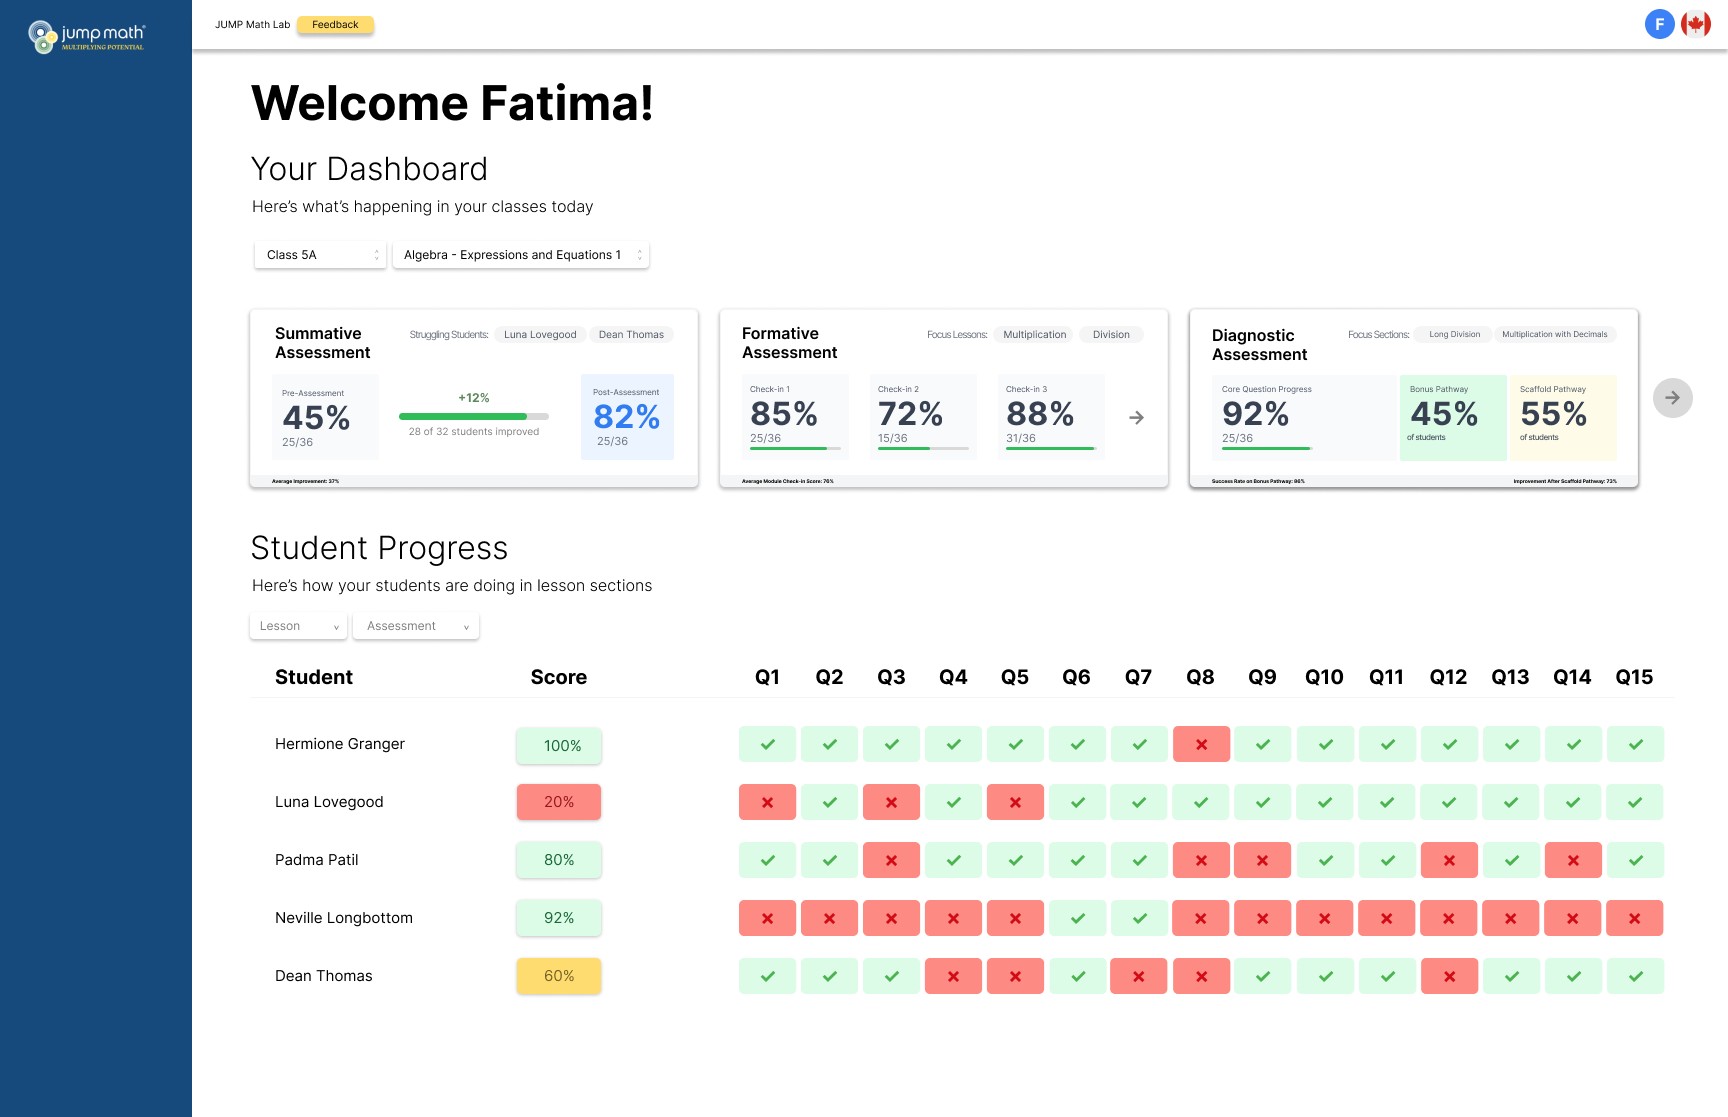
SKETCH 4 OF 4The three assessment viewsA teacher dashboard spec with three assessment cards across the top, the first showing core question progress with the proportion on the bonus pathway and on the scaffold pathway, above a grid of students against questions.FED INTO ·Project 03 · the teacher dashboard ▸Prototyping ▸