SKILL 8 OF 9 · METRICS AND LEARNING ANALYTICS
Learning analytics
Data about what learners do, shaped so that a teacher, a delivery team or a programme board can act on it. I go into the data myself, in SQL on BigQuery?BIGQUERYGoogle’s data warehouse, where the Beeline website analytics are queried with SQL. and in Python.
WHERE IT SHOWS UP · PICK A PROJECT
One grid, four contexts
Making fuzzy outcomes measurable
Engagement, Comprehension, Decision Quality, Confidence and Follow Through. Each metric climbs one rung at a time, from named to trended, and only when the evidence allows it. July 2026 is the baseline for job-search clicks: 1,925.
Analysing the gateways myself
I use BigQuery over the Google Analytics data to analyse how young people move through the gateway pages. The randomised gateway order test came out at z = −6.75, p < 0.001. The analytics tool could only compare three segments at once, which I flagged as a tool limit, and I asked for a user-level export.
- 01QuestionTied to one metric on the ladder.
- 02QuerySQL on BigQuery.
- 03AnalysePython.
- 04ReadThe Ladder of Misinference?LADDER OF MISINFERENCEAlex Edmans’ four checks before trusting a finding: is it accurate, is the sample representative, could something else explain it, and does it hold beyond this case?, before anything is claimed.
An xAPI spec the dashboards read
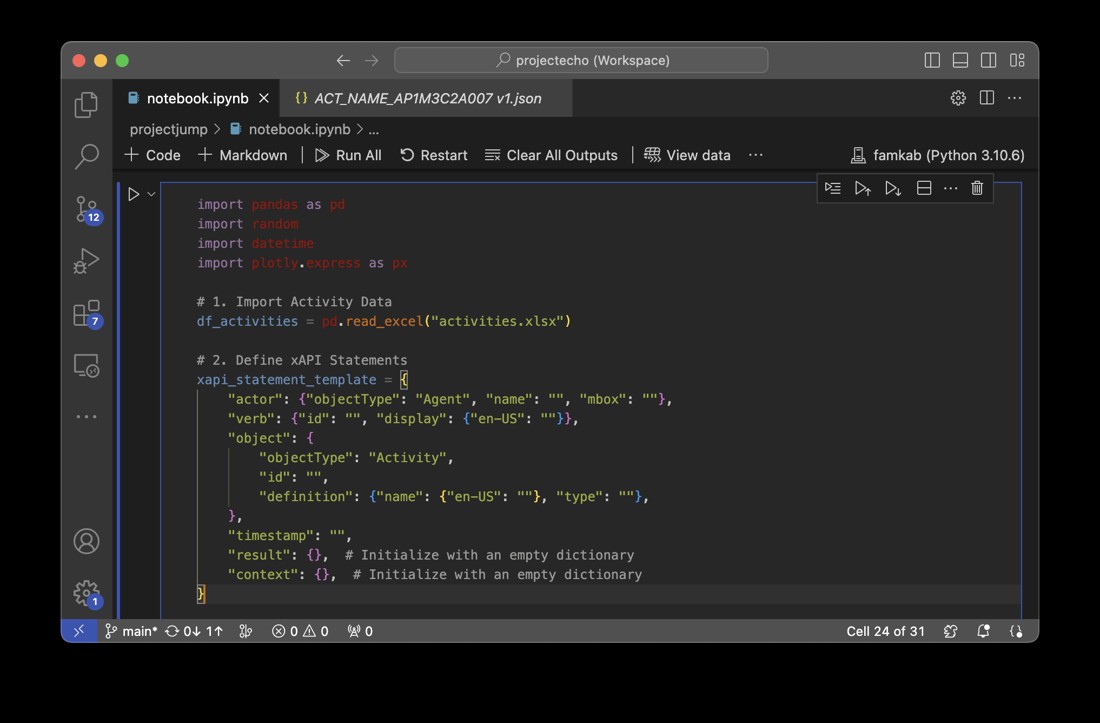
An xAPI?XAPIA data standard that records what learners do inside a course, so dashboards can use it. data spec, with needs separated from wants for the developers, so the teacher dashboard could show diagnostic, formative?FORMATIVEChecks that happen during learning, to adjust teaching. Summative checks measure what was learned at the end. and summative views.
ROUGH WORK · SKETCHED FIRST · 1 SKETCH ▾
Engagement data into a redesign
I redesigned the gamified loops from engagement data and A/B tested the redesign. Learner participation rose by 40%.
OPEN PROJECT 02 ▸